-
-
-
- Services pour bioprocédés
- Services pour centrifugeuse et rotors
- Services pour Mastercycler
- Services pour automates de pipetage
- Services pour congélateurs
- Services pour incubateurs
- Services pour agitateurs
- Services pour appareils de photométrie
- Service de contrôle de la température et de l’agitation
- Service pour pipette
-
-
-
-
- Services pour bioprocédés
- Services pour centrifugeuse et rotors
- Services pour Mastercycler
- Services pour automates de pipetage
- Services pour congélateurs
- Services pour incubateurs
- Services pour agitateurs
- Services pour appareils de photométrie
- Service de contrôle de la température et de l’agitation
- Service pour pipette
-
-
- Centrifugeuses de paillasse
- Centrifugeuses au sol
- Centrifugeuses réfrigérées
- Microcentrifugeuses
- Centrifugeuses multi-fonctions
- Centrifugeuses haute vitesse
- Ultracentrifugeuses
- Concentrateur
- High-Speed and Ultracentrifugation Consumables
- Tubes
- Plaques
- Gestion des appareils
- Gestion des échantillons et des informations

Absorbance Measurements – the Quick Way to Determine Sample Concentration
Lab Academy
- Photométrie
- Photomètres
- Test
Within molecular and biochemical applications, as well as in medical diagnostics, determination of the concentrations of substances in solution is a crucial analysis step. Frequently, photometric methods are employed for this purpose, as these can be conducted easily and quickly, and because they often represent the most cost-effective option.
In order to determine the concentration of an analyte, most often the wavelength is utilized at which the molecule displays the highest absorbance (peak wavelength). In the case of nucleic acids and proteins, for example, this would be 260 nm and 280 nm, respectively. The laws of physics described by the Lambert-Beer law form the basis for the calculation of the concentration of a substance from photometric measurements. This occurs according to the steps of the formulae listed below:
- Transmission or transmittance (T) = I/I0
Transmission is determined in a photometer, using the ratio between the light which exits and the light which enters the sample. - Absorbance (A) = log (I0/I)
Absorbance is calculated from the negative decadic logarithm of transmission. - Absorbance (A) = C x L x Ɛ => Concentration (C) = A/(L x Ɛ)
The Lambert-Beer law describes the dependence of the absorbance on the concentration of the sample (C), the optical path length (L) as well as the dependence on a sample-specific extinction coefficient (Ɛ), which pertains to a specific substance at a specific wavelength. Sample concentration is then calculated by converting the formula.
These three statements are described in more detail below.
Determination of transmission (T = I/I0)
Lire moins
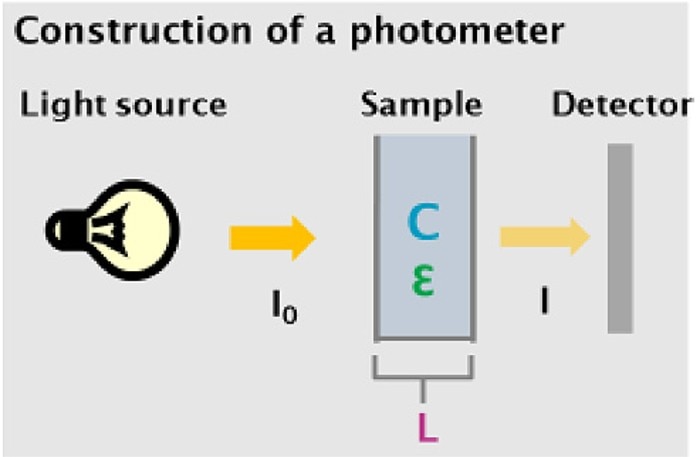
Figure 1: Simplified assembly of a photometer depicting the sample and parameters which are relevant to the law of Lambert-Beer
I0: Light entering the sample
I: Light exiting the sample
C: Concentration of the sample
L: Light path/thickness of the sample
Ɛ: Extinction coefficient

The light source of a photometer emits light at a defined intensity I0, which is guided through the sample solution. A portion of the light will be absorbed by the sample. The portion which traverses the sample is registered by the detector as intensity I. The ratio I/I0 describes the transmission of the sample at a defined wavelength.
Calculation of absorbance (A = log (I0/I)
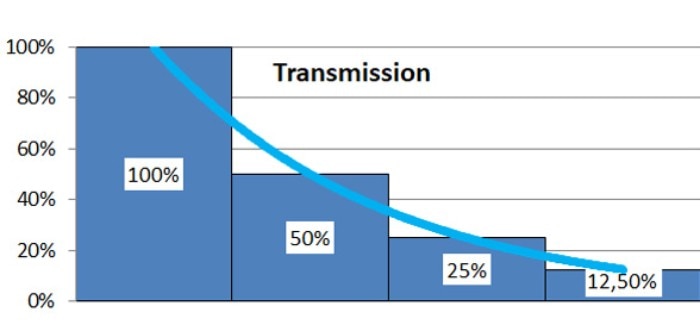
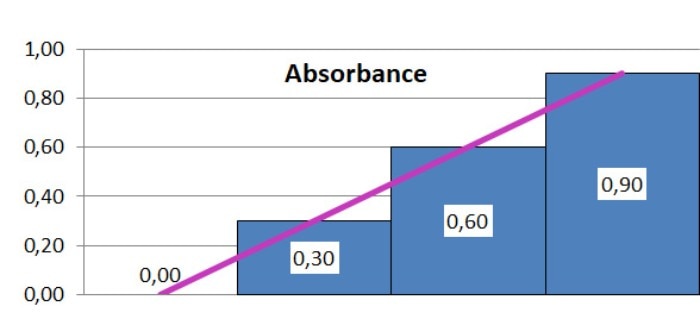
Modern photometers automatically convert the transmission of a sample into absorbance, which is defined as the negative decadic logarithm of transmission. The question arises why transmission is not directly used for the calculation of sample concentration. Figure 2 clarifies the connection between transmission and absorbance. If several samples, which each allow 50 % of the light which enters the sample to traverse, are connected in series, the exponentially declining transmission curve, depicted below, will result. If the values are instead expressed in a logarithmic fashion, a linear dependency will result. In this way, absorbance is proportional to concentration (as well as path length), which simplifies calculations considerably.
Figure 2: The connection between transmission and absorbance of light:
Lire moins
a) Connecting samples in series, each of which allow transmission of 50 % of the light which enters the sample. The percentage pertains to the initial light intensity.

b) Exponentially declining transmission curve

c) Graphic representation of the absorbance (utilizing the decadic logarithm of transmission)

In order to derive the concentration of a sample from its absorbance, additional information is required. The Lambert-Beer law, which forms the physical basis for photometric applications, describes that the absorption of light by a sample is directly proportional to its concentration and its path length. Altogether, three parameters contribute to the absorbance value of a sample: first, the concentration (C) of the molecule; second, the path length (L) of the sample, which generally equals the path length of the cuvette. Then there is the extinction coefficient (Ɛ). The extinction coefficient is a physical constant unique to the molecule; it describes its property of absorbing light at a specific wavelength. This material-specific constant is known for a number of substances, including nucleic acids and various proteins, and the values have been published in the pertinent literature. In these cases, concentration can be determined instantly. If the value is not known, however, it is possible to enlist the help of a calibration curve. In order to generate a calibration curve, standards are required, i.e. solutions which contain known concentrations of the substances to be analyzed. These are measured in the photometer prior to the actual sample. The concentration of the analyte is then calculated using the standard curve.
Further to quantification, absorbance measurements may also reveal qualitative information about the sample: for example, the purity of nucleic acids and proteins may be determined by subjecting the sample to measurements at additional wavelengths, whereas information on enzyme activity is generally obtained through repeated measurements over time.
Lire moins

