MENÜ
AT | EUR
AT | EUR
-
- Tischzentrifugen
- Standzentrifugen
- Gekühlte Zentrifugen
- Mikrozentrifugen
- Mehrzweckzentrifugen
- Hochgeschwindigkeitszentrifugen
- Ultrazentrifugen
- Concentrator
- IVD Produkte
- High-Speed and Ultracentrifugation Consumables
- Zentrifugenröhrchen
- Zentrifugenplatten
- Gerätemanagement
- Proben- und Informationsmanagement
Es konnten keine Ergebnisse gefunden werden.
Such-Empfehlungen

OD600 Measurements: Tips for Implementation
Natascha Weiß Lab Academy
- Microbiology
- Lab Routine
- Culture of Microorganisms
- Photometry
- Reproducibility
- Essay
The measurement of optical density at 600 nm is a simple and widely used method to monitor the growth of microorganisms in liquid culture and to determine their cell number.
While simple, this technology is not to be underestimated. A culture of microorganisms constitutes a suspension, so that light is mainly scattered rather than absorbed during the process of photometric measurement. Light scatter is mainly influenced by the shape and the size of the organism as well as by the design of the photometer [1, 2]. This means that a cell number, or biomass, cannot be calculated directly from the OD (optical density) values measured. Such conversion requires prior calibration of the photometer with the cultivated strain, which involves the generation of a standard curve [2].
The standard curve may be based on different parameters, depending on which factor is relevant for the experiment at hand. If, for example, the increase in biomass of a culture is of interest, the optical densities obtained from different dilutions of a culture can be plotted against the dry weight determined for these samples. This method is equally well suited for the determination of the linear range of the sample within this specific photometer. The linear relationship between OD600 and concentration is very limited in the case of scattered light measurements compared with absorbance measurements, as higher densities lead to multiple scattering among the particles. This effect will increase the probability that more light will eventually reach the detector. The resulting standard curve will show up to which optical density the values follow a linear progression.
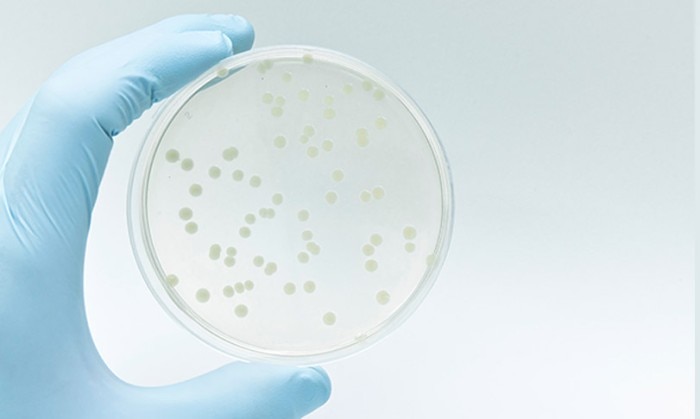
If it is crucial to determine the number of live cells within a culture, OD600 may be plotted against live cell numbers (dead cells and cell debris also contribute to light scatter). To this end, samples are withdrawn from the liquid culture at multiple time points. One part is measured at 600 nm using a photometer, while the other part of the sample is subjected to serial dilution. A defined volume of each dilution is then spread onto a separate agar plate and incubated. The number of colonies grown on the plates is counted, and the colony forming units (cfu)/mL or the cell count of the original culture can be calculated accordingly (figure 1). If the values are plotted against the concentration, a calibration curve will result that will serve as the basis for subsequent measurements of the same strain using the same instrument.
Mehr erfahren
Weniger lesen
Figure 1:
Determination of the number of bacterial colonies on an agar plate

The following points should be considered when measuring OD600: Since a culture constitutes a suspension, homogeneity of the sample is critical. For this reason, the culture should be mixed well prior to withdrawal of samples and, if applicable, mixing should be repeated just prior to measurement. The same fresh culture medium that is used for the culture should serve as the blank. If, however, higher accuracy is required and if the medium changes color over the course of the incubation, it may be advantageous to use the culture supernatant as the blank. If the measured optical density exceeds the linear range, the sample should be diluted accordingly using culture medium. Further possible causes for varying measured values are listed in White Paper 27 [3].
Mehr erfahren
Weniger lesen
References:
[1] Janke SA, Fortnagel P, Bergmann R. Microbiological turbidimetry using standard photometers. BIOspektrum, 1999; Vol. 6: 501-502.
[2] Harnack K, Spolaczyk R, Janke SA. Turbidity measurements (OD600) with absorption spectrometers. BIOspektrum, 1999; Vol. 6: 503-504.
[3] Factors Influencing OD600 Measurements. White Paper 27: www.eppendorf.com
Mehr erfahren
Weniger lesen

